The observed radiation flux in the emission cores of the chromospheric spectral lines of Ca II and Mg II of slowly rotating stars (stars which are not dominated by magnetic fields), occupy a so-called {it basal flux limit} line in a diagram of the observed emission flux versus T_{eff} (or color index B-V) (see Fig. 3). It is thought that the more emission a star has relative to the basal flux limit, the more rapid it rotates and the more it is covered by magnetic fields and affected by magnetic heating. Observationally it is found that all nonmagnetic stars occupy essentially the same basal flux curve, regardless of whether they are giants (low gravity) or dwarfs (high gravity) or whether they have solar metal abundance or 1/100 solar metal abundance.
Figure 3 shows observations by Rutten et al. (1991) together with our simulations of main sequence stars, giants and low metallicity stars (Cuntz, Rammacher & Ulmschneider 1994, Buchholz, Ulmschneider & Cuntz 1998). It is surprising that despite our crude approach the theoretical values are not only in the vicinity of the observations but that they actually lie near the basal flux line which they should because we did not take magnetic heating effects into account. What is even more surprising (in view of the enormous T_{eff} dependence seen in Fig. 1a) is that the slope of the basal flux line versus B-V is nicely reproduced as well as the observational fact that the giants and low metallicity stars have the same basal flux line. This is taken by us as a strong indication that the acoustic heating model for slowly rotating stars appears to be valid. In other words, acoustic waves are identified as the main heating mechanism for nonmagnetic chromospheres. This view, however, has to be confirmed with much more sophisticated and realistic simulations of acoustic wave propagation in the future.
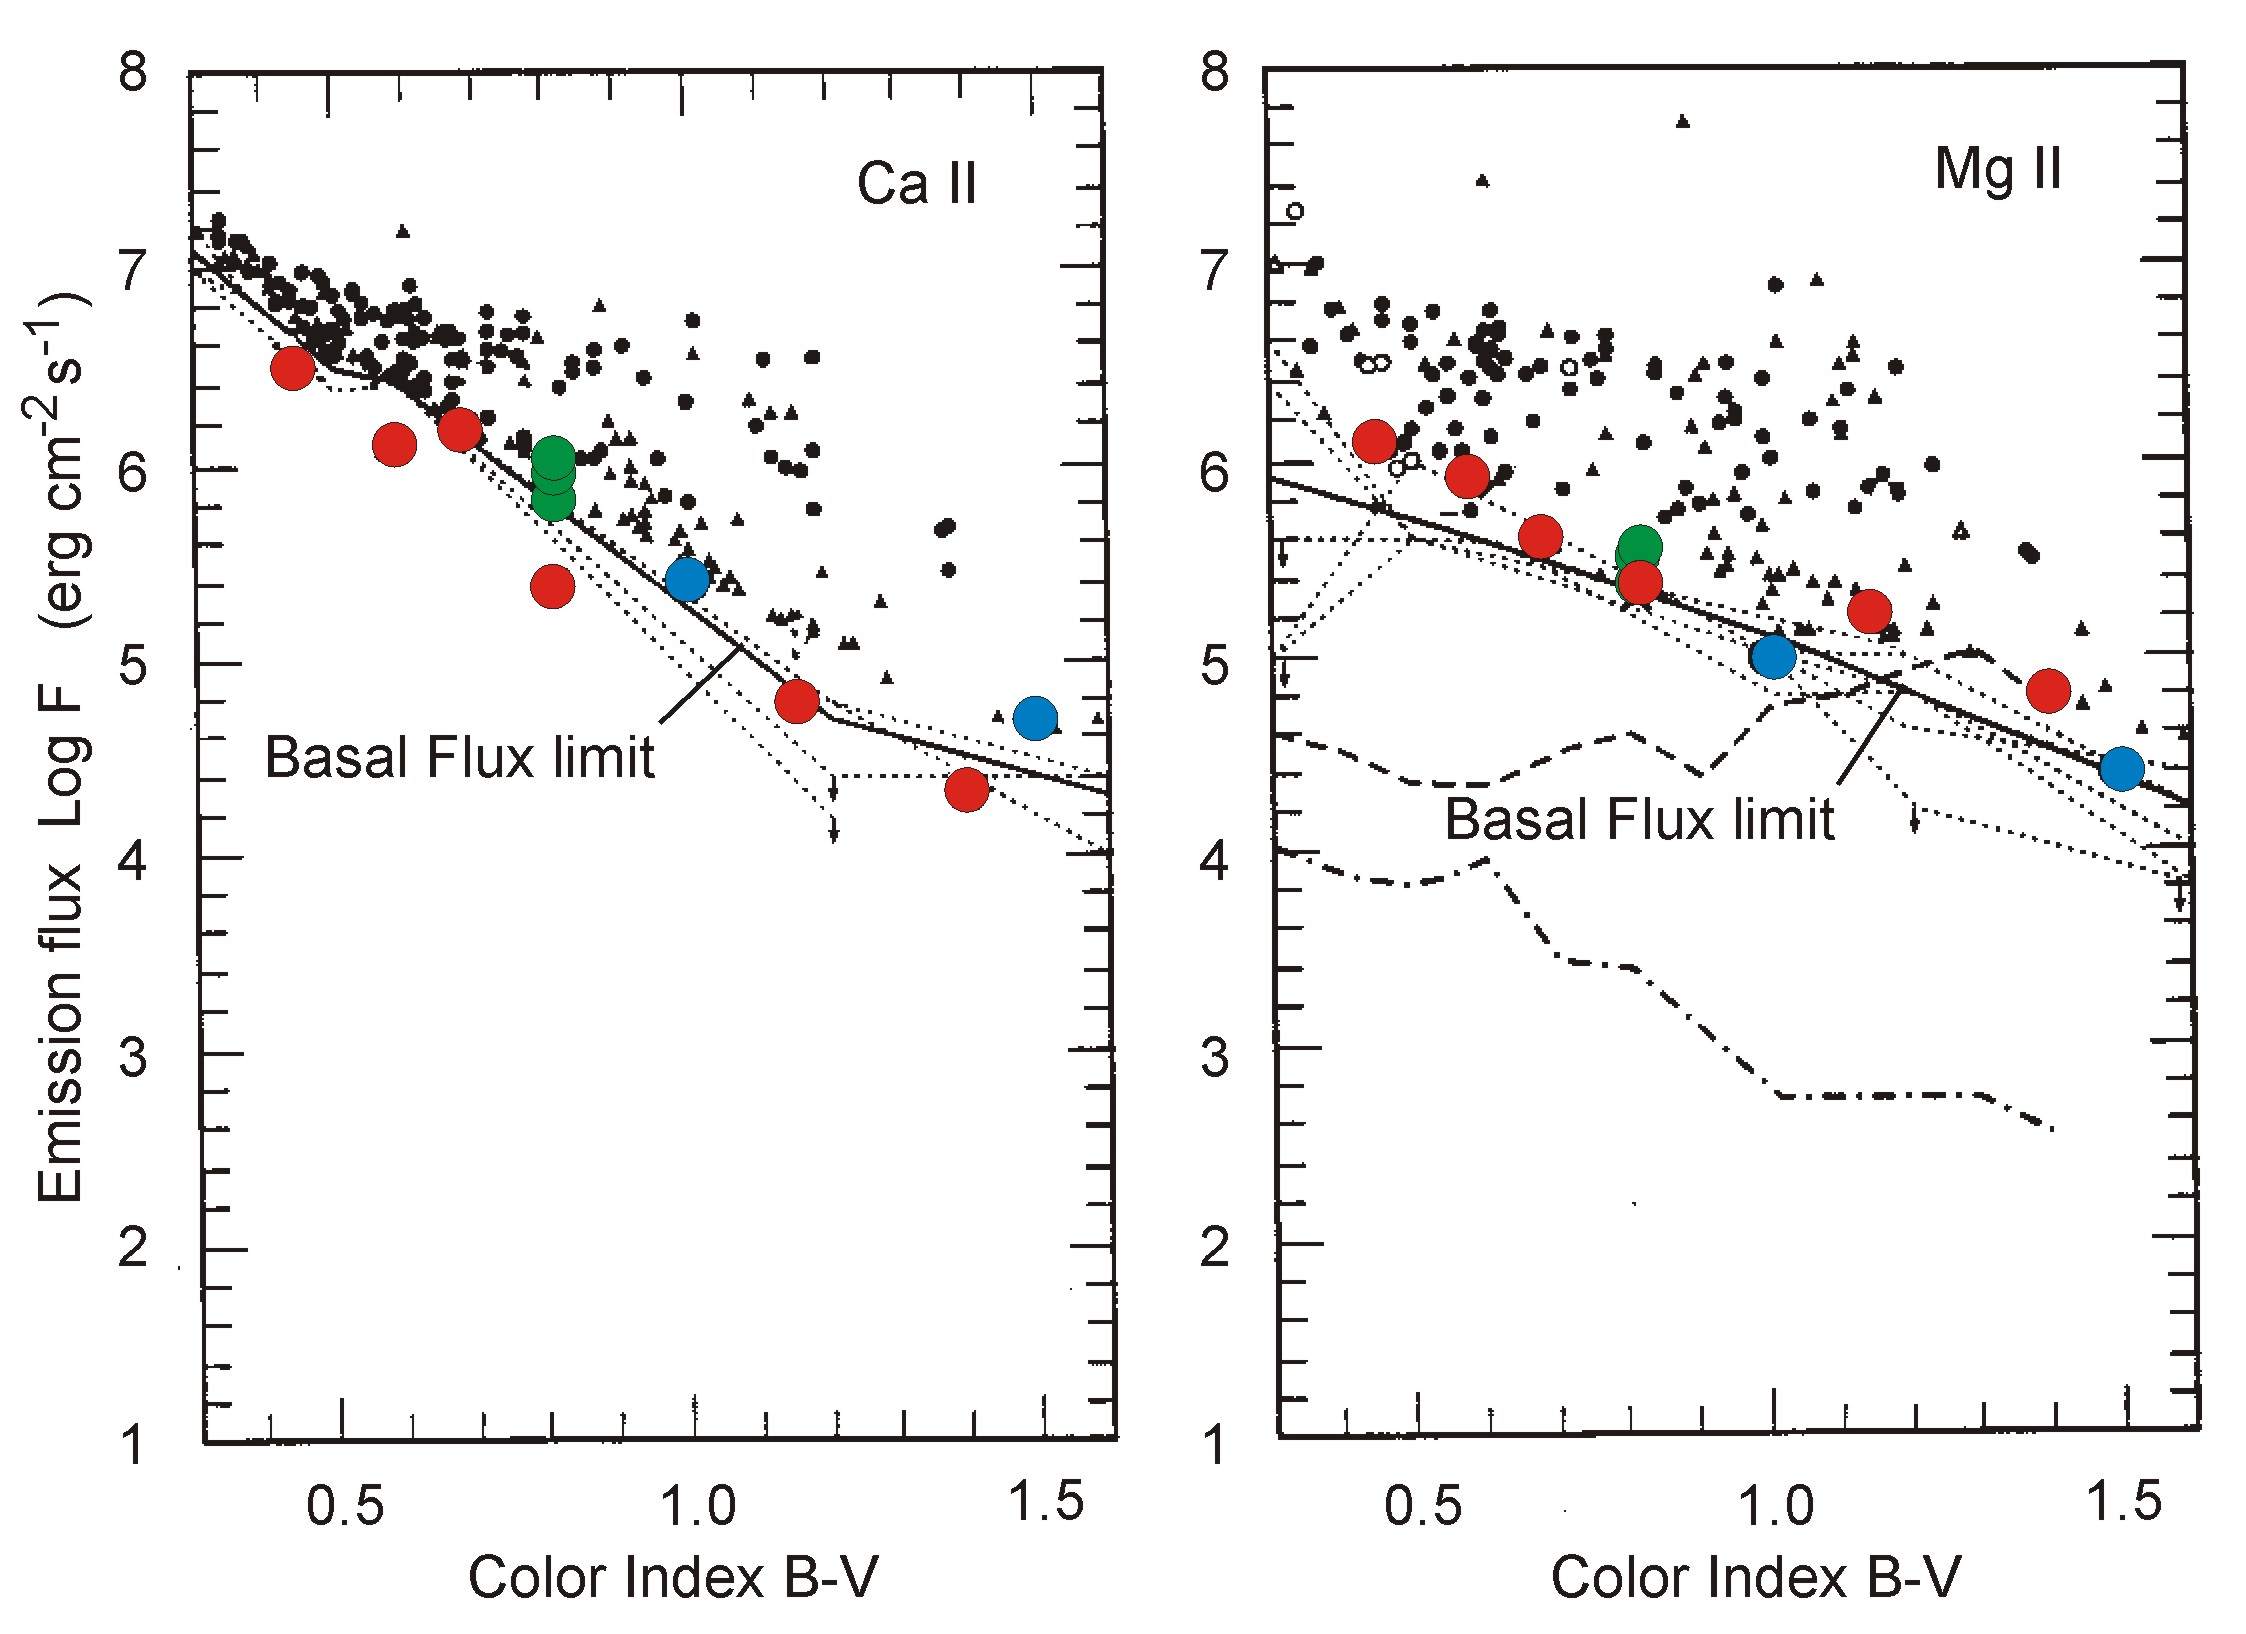
Fig. 3 Comparison of the chromospheric line core emission fluxes from acoustically heated theoretical chromosphere models with observations of Ca II and Mg II lines by Rutten et al. (1991). The basal flux curve is shown drawn. Red dots mark main-sequence stars of solar abundances, blue dots giant stars of solar abundances, while green dots giants with 1/1, 1/10 and 1/100 solar abundances, after Cuntz, Rammacher & Ulmschneider (1994) and Buchholz, Ulmschneider & Cuntz (1998)


