Graphical User Interface
To make the model more interactive, EpiDemo has a simple Graphical User Interface, which can be configured in various ways. It is important to note that this GUI is not a plug-and-pay GUI: you must still set up the proper parameters in a Python script. The purpose of the GUI is just to allow you to get an immediate response to changes of parameter values. This gives a better feeling for how the various parameters affect the result.
The GUI is located in epidemo/epidemo_lookback_gui.py.
Getting started
Here is a simple example:
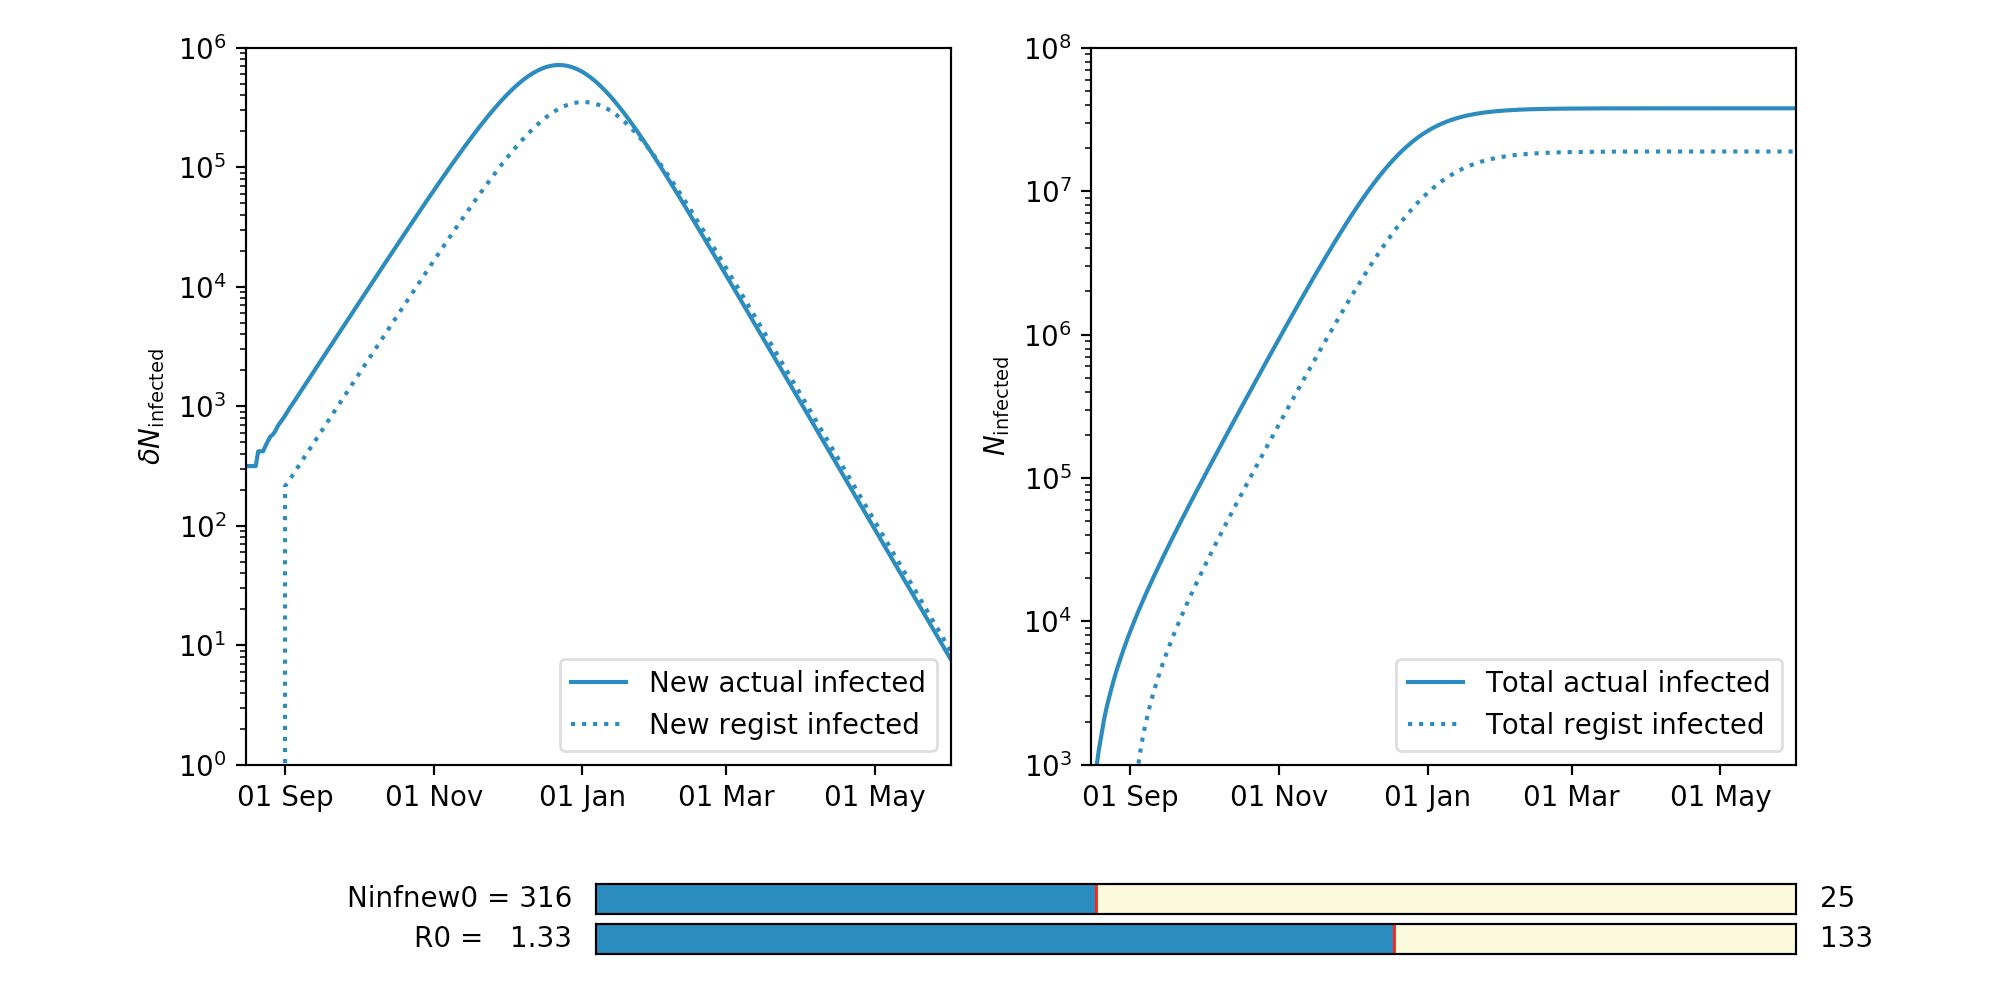
from epidemo.epidemo_lookback_gui import *
model,axes  = lookback_model_gui(83000000,330,1.33,'2020-08-16','2021-06-01',\
                                 show_actual=True,show_regist=True)
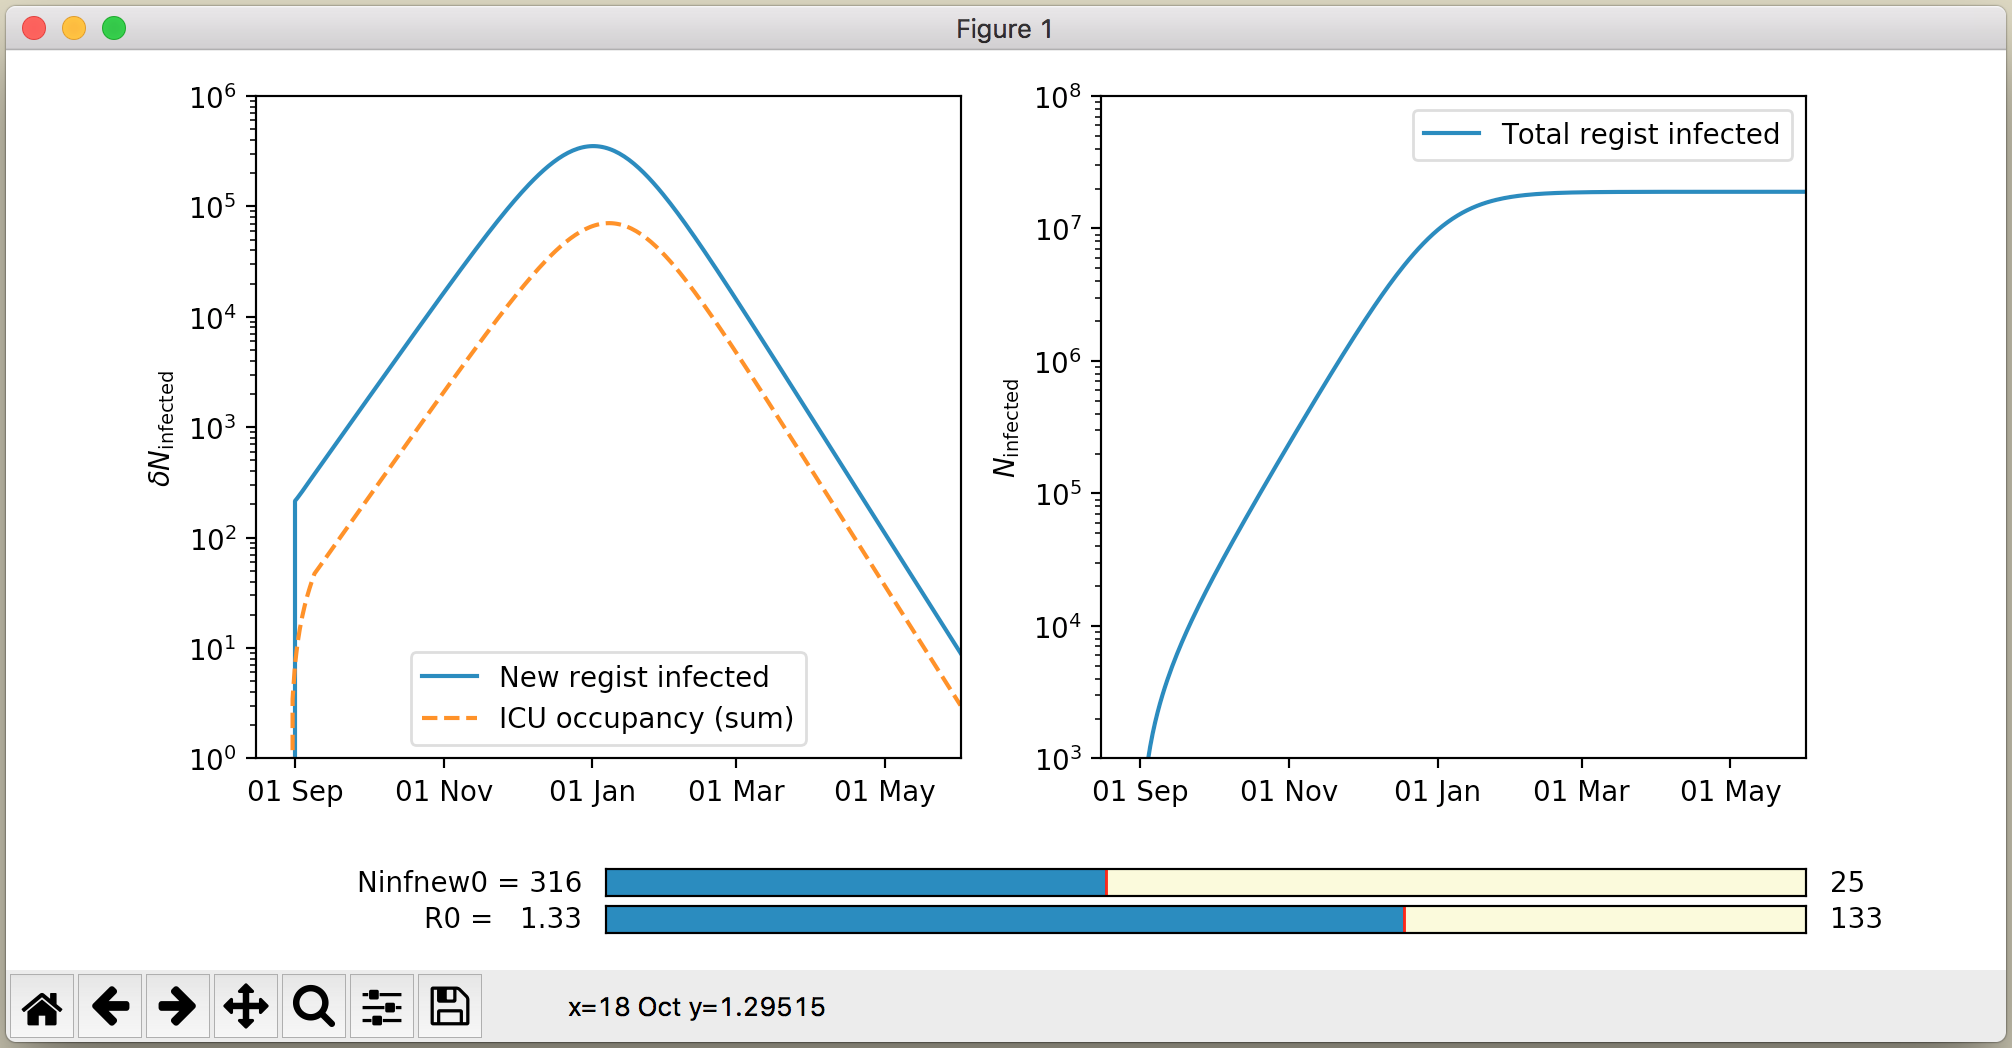
Or showing the registered and ICU cases:
from epidemo.epidemo_lookback_gui import *
model,axes  = lookback_model_gui(83000000,330,1.33,'2020-08-16','2021-06-01',\
                                 show_actual=False,show_regist=True,show_icu=True)
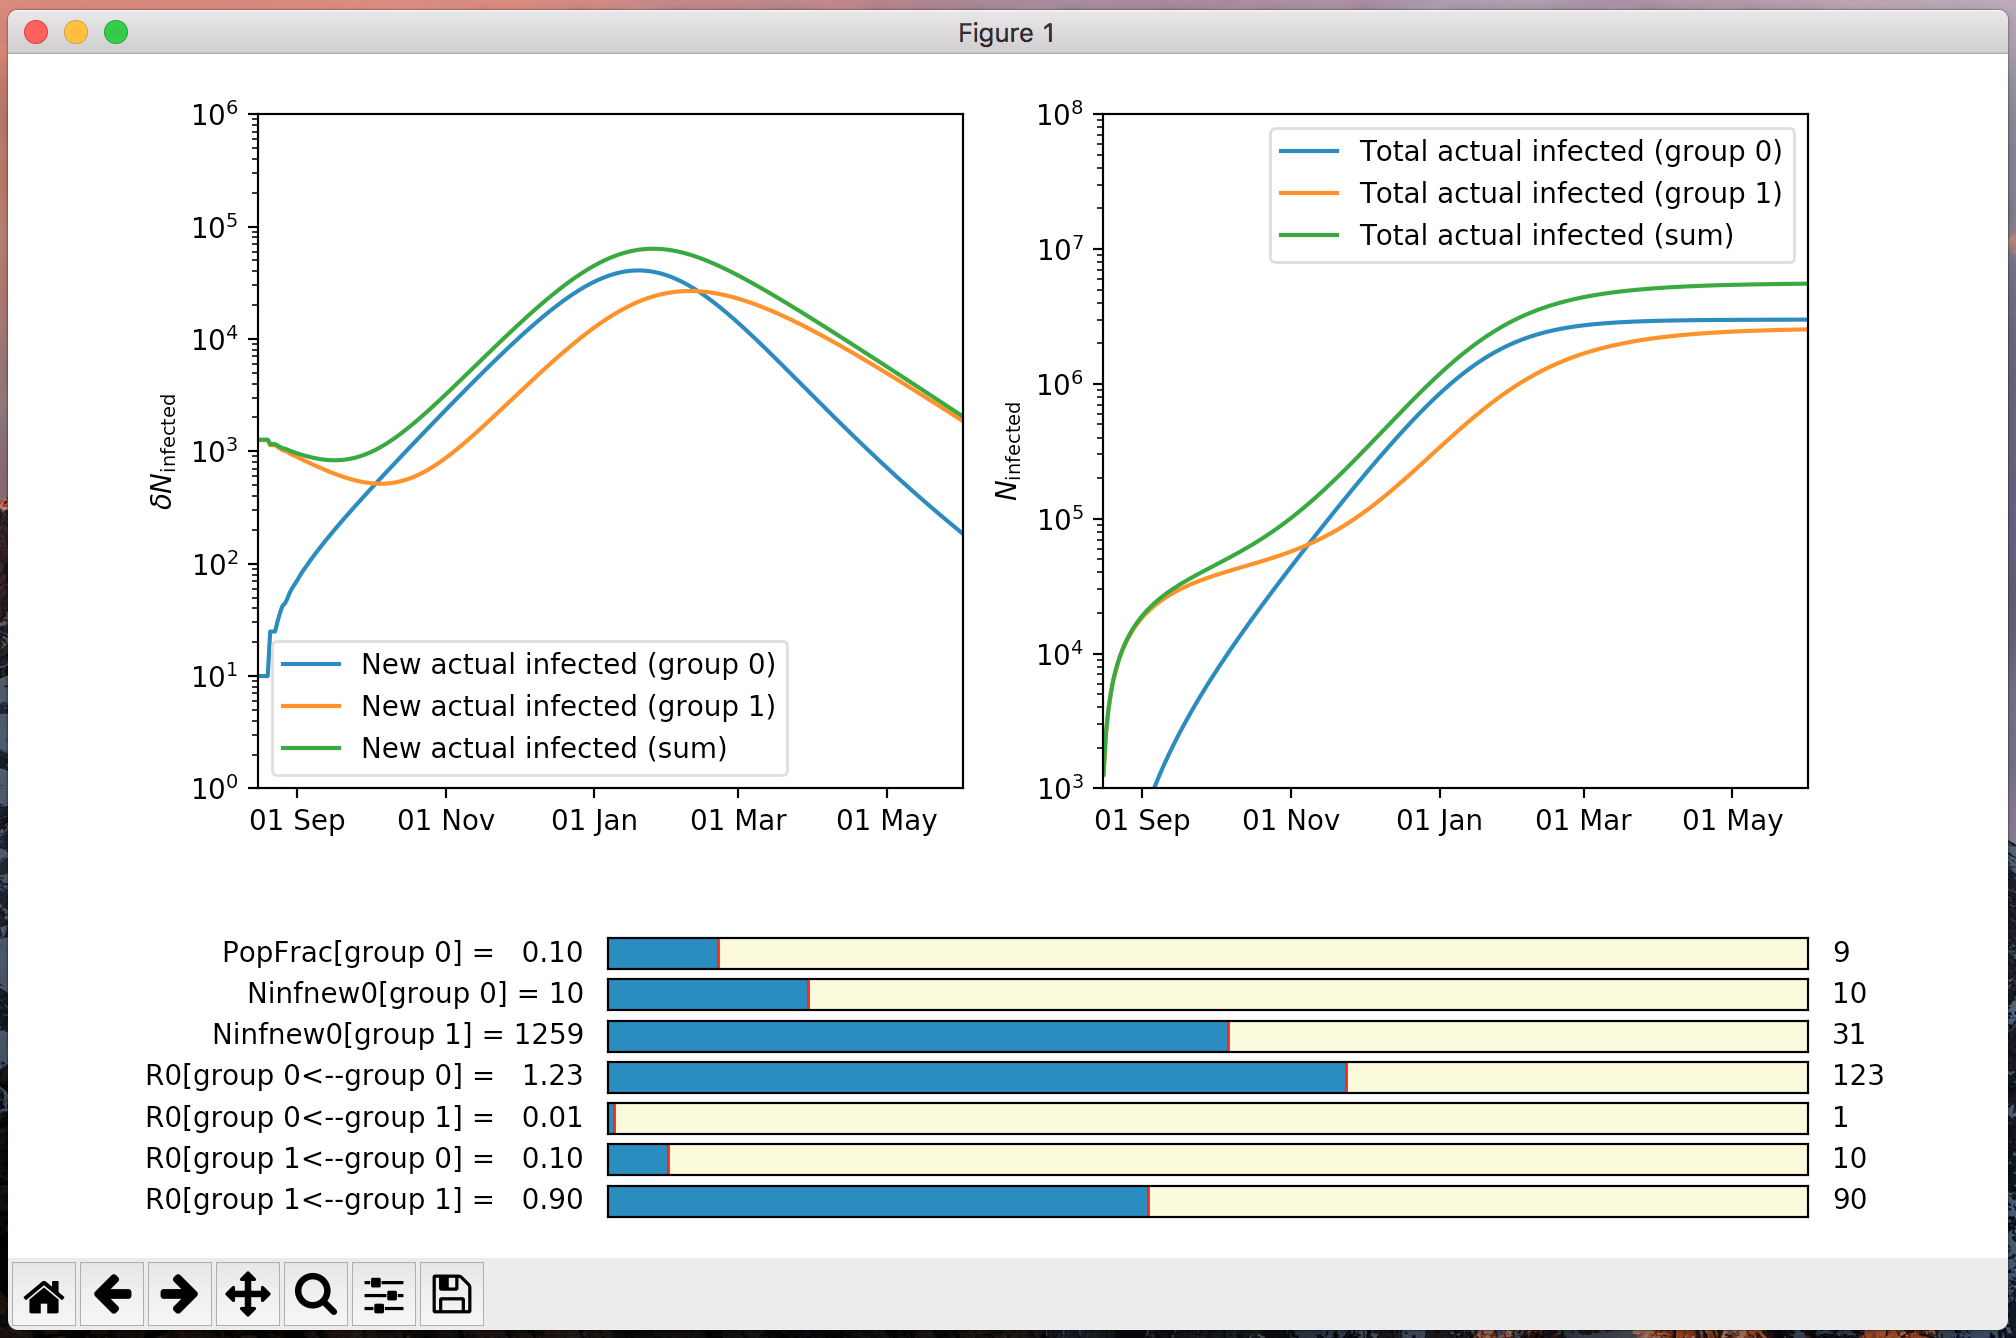
Likewise a two-group model:
from epidemo.epidemo_lookback_gui import *
Npoptot     = 83000000
frac        = 0.1
model,axes  = lookback_model_gui([Npoptot*frac,Npoptot*(1-frac)],\
                                 [10,1300],[[1.23,0.01],[0.1,0.90]],\
                                 '2020-08-16','2021-06-01',\
                                 show_actual=True,show_regist=True)
Modeling policy changes
If you want to split time into a “before policy change” and “after policy change”, for instance the implementation of a (partial) lockdown, you can do this as follows:
from epidemo.epidemo_lookback_gui import *
model,axes  = lookback_model_gui(83000000,330,1.33,'2020-08-16','2021-06-01',\
                                 R0MatrixPre=1.33,date_switch='2020-11-02',\
                                 show_actual=True,show_regist=True)
The R0MatrixPre is the fixed \(R_0\) before the change. On date
date_switch the \(R_0\) is changed to the value that is variable
with the slider. In the above example the initial value is taken the same
as the R0MatrixPre.
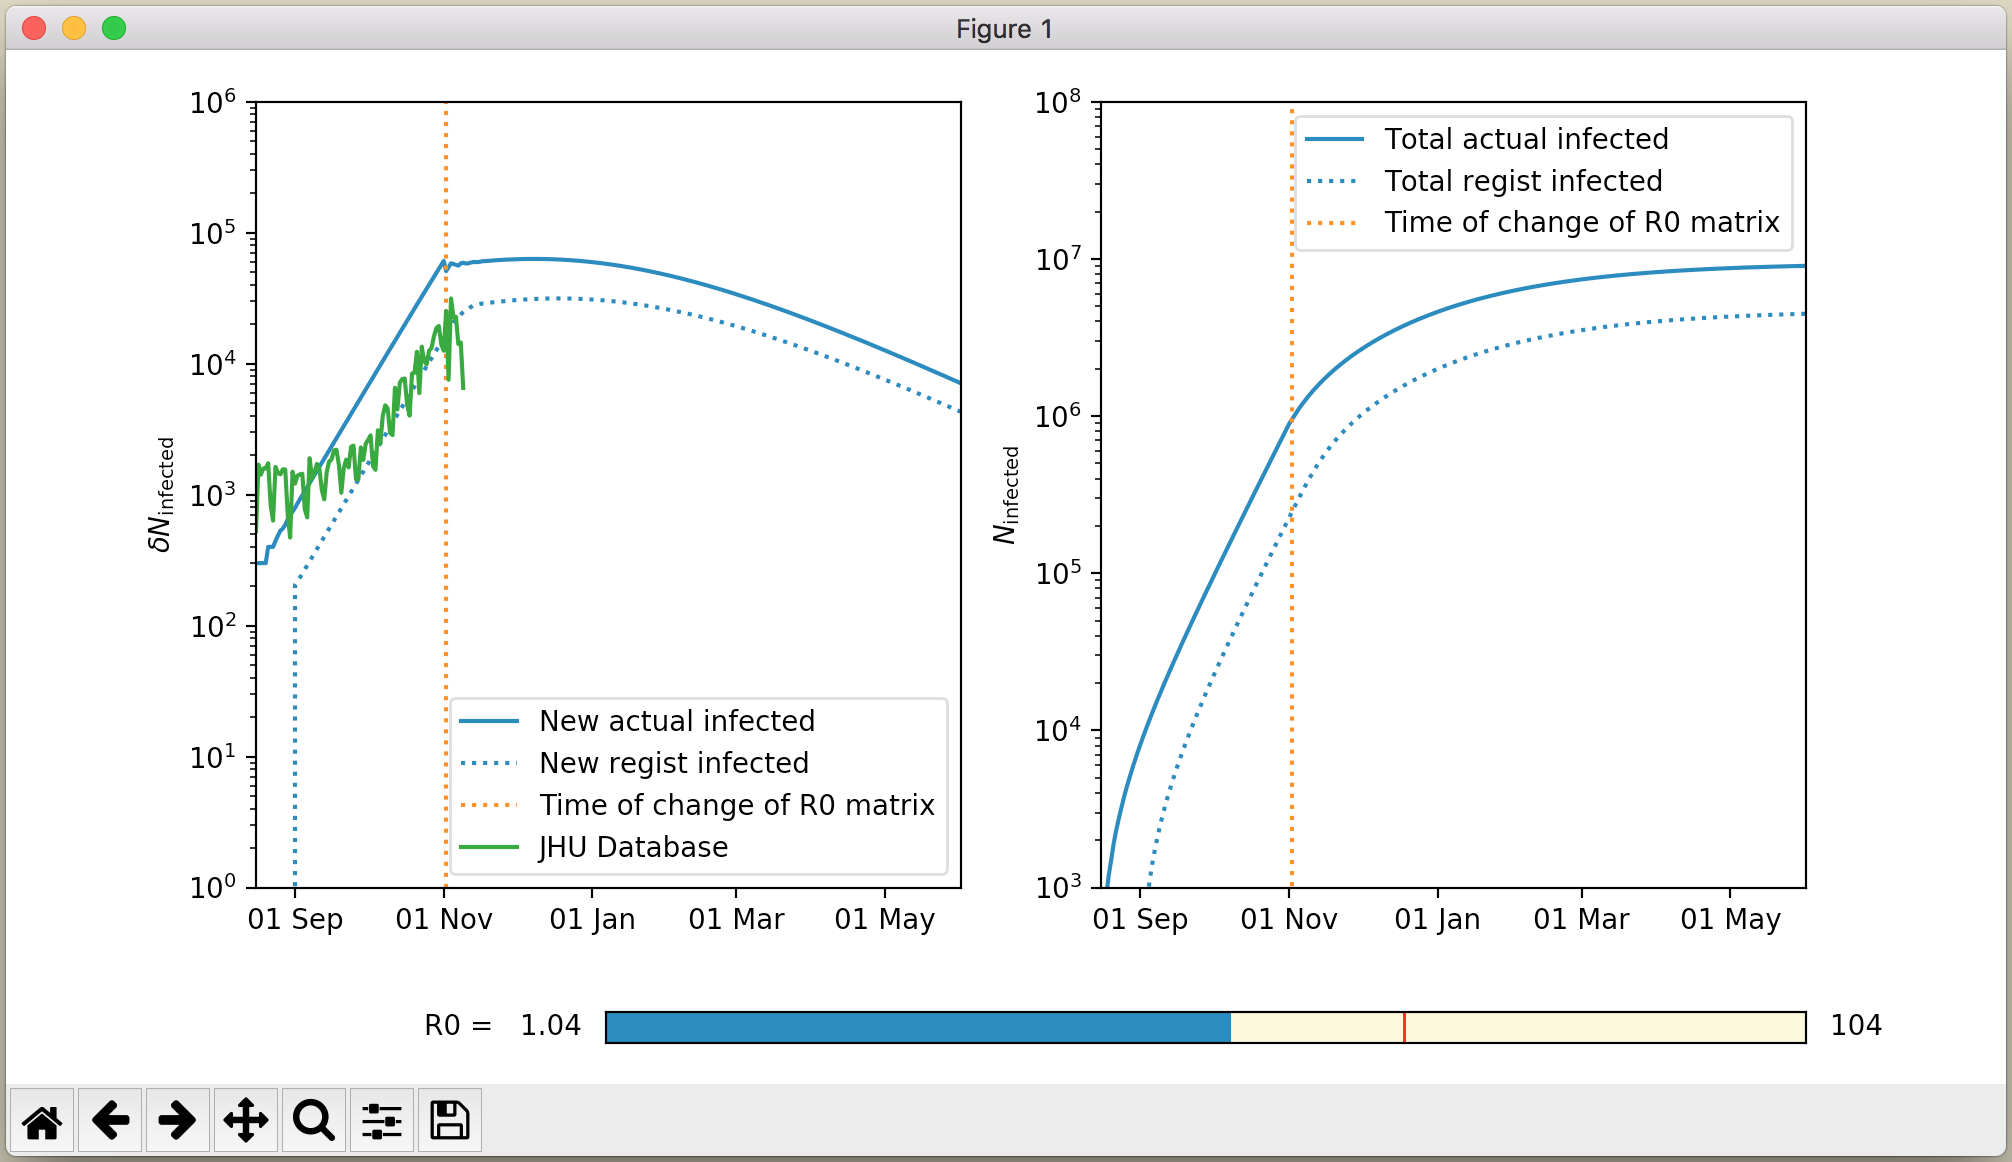
Overplotting data
If you want to compare your model to actual data, you can use the axes
return value for overplotting these data. In the demodata/ directory you
find some data extracted from the RKI and JHU databases for Germany.
Here is an example of how to overplot those data:
from epidemo.epidemo_lookback_gui import *
jhu         = np.loadtxt('demodata/jhu_germany_daily.txt')
t_start     = datetime.date(2020, 1, 16).toordinal()   # Start of time series
model,axes  = lookback_model_gui(83000000,300,1.33,'2020-08-16','2021-06-01',\
                                 R0MatrixPre=1.33,date_switch='2020-11-02',\
                                 show_actual=True,show_regist=True,addlegend=False)
axes[0].plot(jhu[:,0]+t_start,jhu[:,1],label='JHU Database')
axes[0].legend()
axes[1].legend()
Further example models
In the directory examples/ you can find several further examples.