Visualization with VTK tools (e.g. Paraview or VisIt)
Since 3-D models can be very hard to visualize, and since RADMC-3D is not made for quick rendering, it can be very useful to make use of a number of freely available 3-D rendering tools, for example:
Paraview www.paraview.org
VisIt visit.llnl.gov
RADMC-3D can create data files for use with these tools. The file format is VTK (Visual Tool Kit), which is a simple ascii file format which is used by various programs. Those tools are not only useful for visualizing the 3-D structure of the model, but also for visualizing the structure of the grid which can be, when using AMR, rather complex.
The file that RADMC-3D writes is called model.vtk. You should be able to
open it directly from within e.g. paraview. Figures Fig. 28
and Fig. 29 gives an example of how you can analyze a
complex geometry with AMR refinement with Paraview. The file {em always}
includes the information about the grid. In addition you can also make RADMC-3D
add scalar fields or vector fields.
To create a VTK file for viewing the grid only, type:
radmc3d vtk_grid
To create a VTK file for viewing the gas density (this file then also includes the grid of course) type:
radmc3d vtk_gas_density
Since density can span a huge range, the 10-log of the density (in units of gram/cm\(^3\)) is written instead. For the gas temperature:
radmc3d vtk_gas_temperature
which is written in Kelvin (and linearly, not log). For the dust density of dust species 1:
radmc3d vtk_dust_density 1
and for dust species 2:
radmc3d vtk_dust_density 2
Also these densities are 10-log. RADMC-3D typically computes the dust temperature using a Monte Carlo approach. By typing
radmc3d vtk_dust_temperature 1
RADMC-3D will try to read the dust temperature from the file
dust_temperature.dat (if this file has been created
earlier by a radmc3d mctherm call) and then create
the VTK file. You can also let RADMC-3D compute the temperature
directly and write it out to VTK right afterward:
radmc3d mctherm vtk_dust_temperature 1
If you are doing line transfer you may wish to visualize the number density of the molecules (or atoms):
radmc3d vtk_molspec 1
(for molecular species 1). This number density (in cm\(^{-3}\)) is also written in 10-log form. You may also wish to visualize the polulations of level 1 (ground state) of molecule 2:
radmc3d vtk_levelpop 2 1
The gas velocity field can be written to VTK file by
radmc3d vtk_velocity
This is a vector field.
Note: The VTK mode works for 3-D cartesian and 3-D spherical coordinates (thanks, Attila Juhasz, for the 3-D spherical mode!).
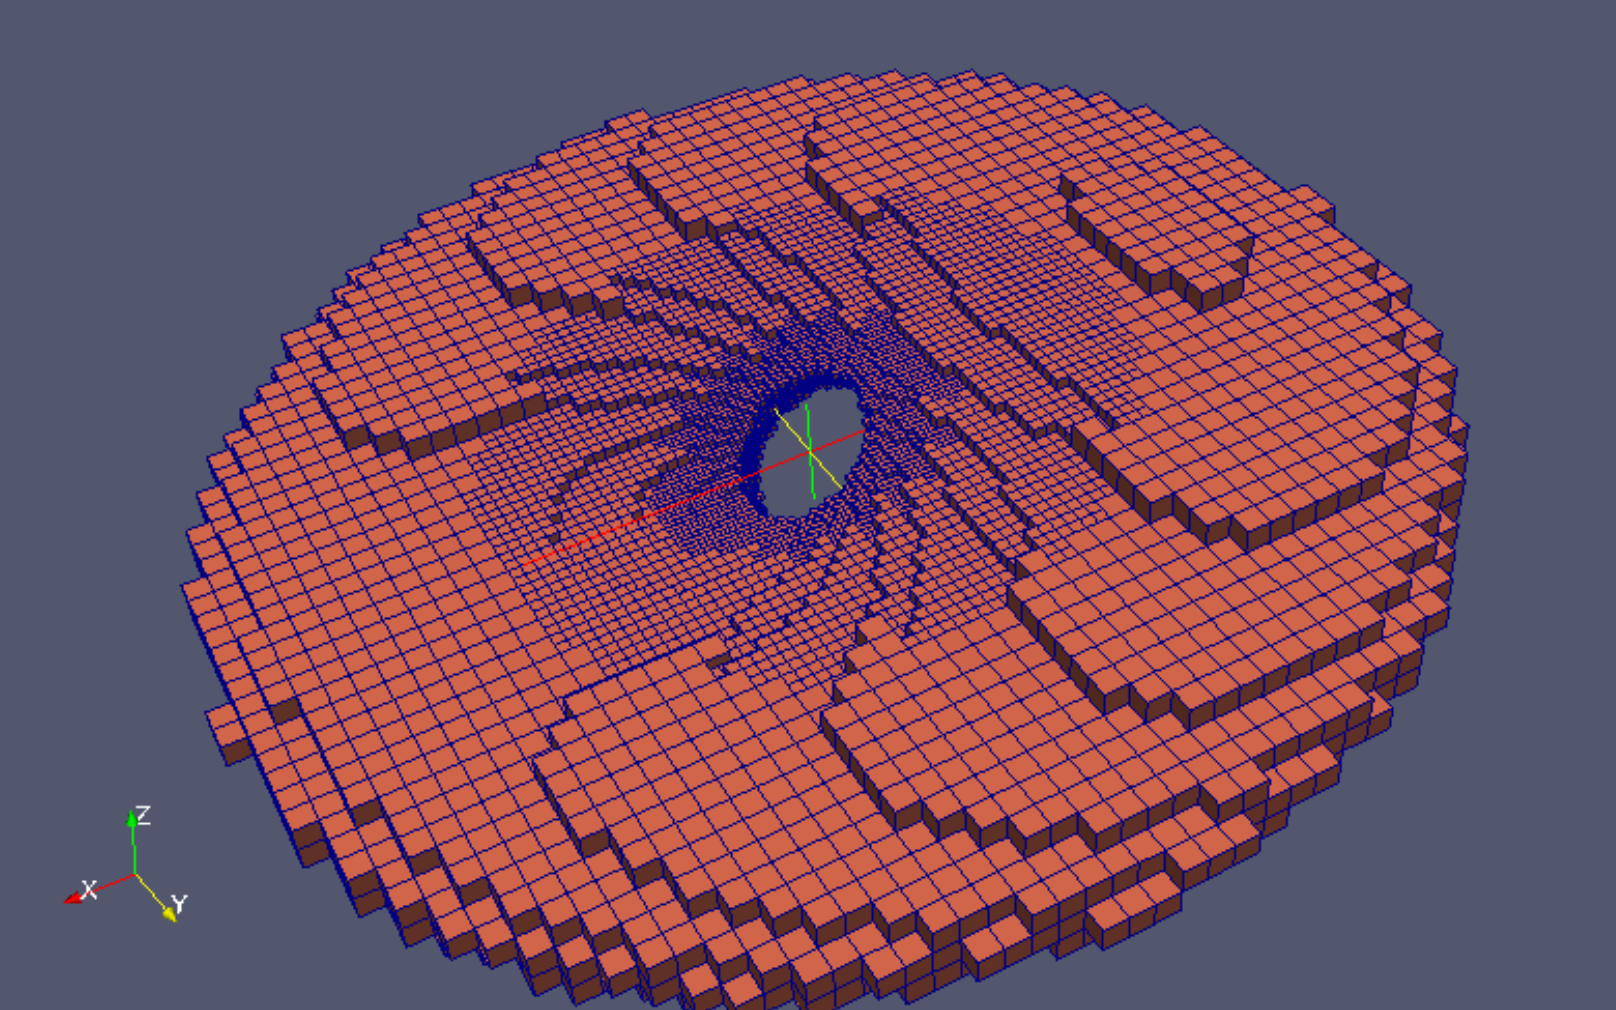
Fig. 28 Example of image created with Paraview, using the VTK output of RADMC-3D. The model shown here is a warped disk model by Katherine Rosenfeld, in 3-D cartesian coordinates with oct-tree AMR refinement.
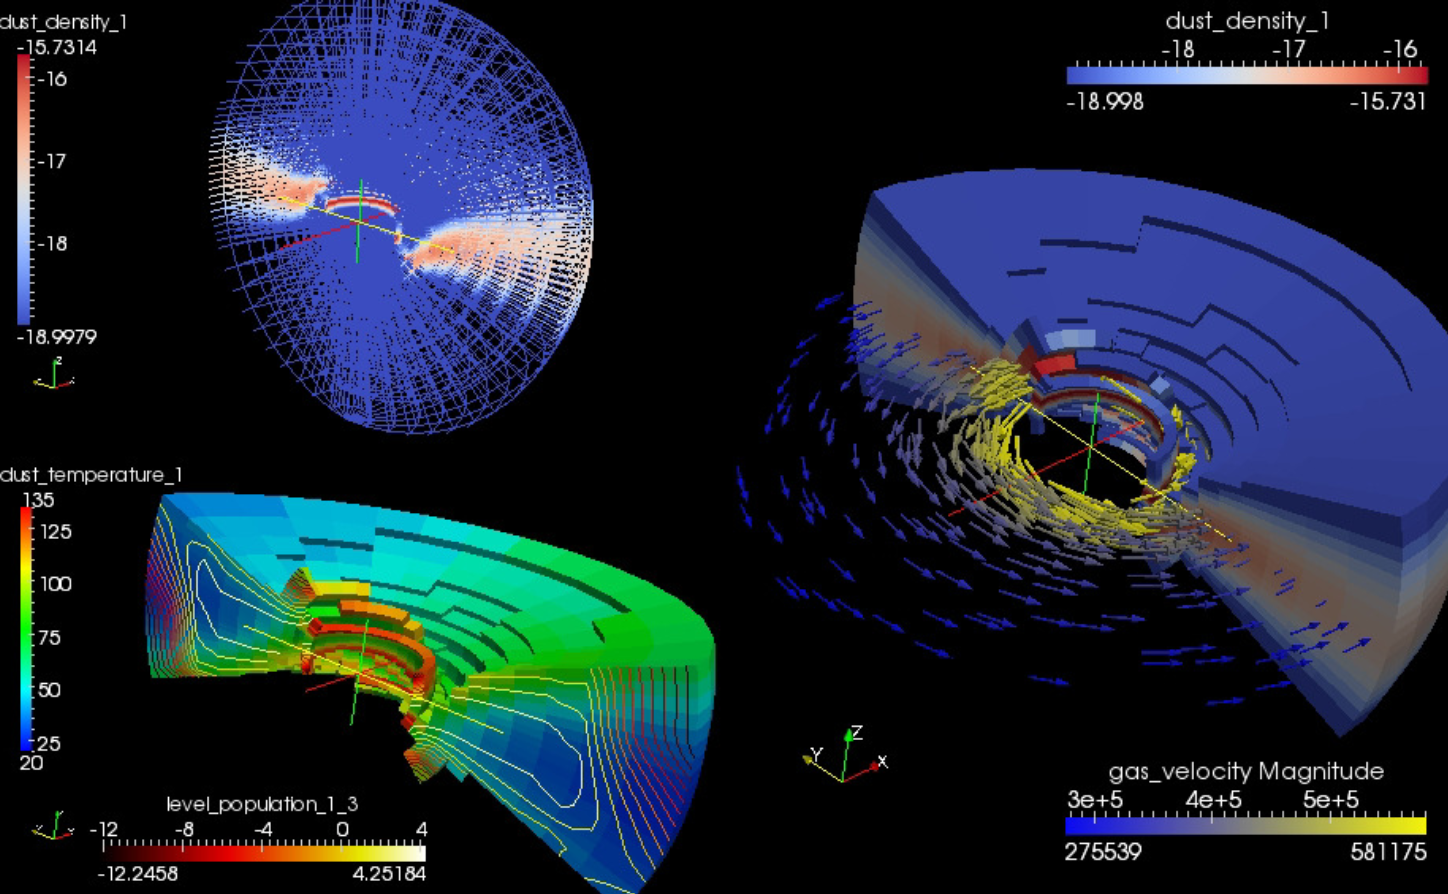
Fig. 29 Example of image created with Paraview, using the VTK output of RADMC-3D. The model shown here is a warped disk model by Attila Juhasz, in 3-D spherical coordinates with separable refinement, but without AMR refinement. The model is kept low-resolution on purpose, to show the grid structure better.